Friday, December 12, 2014

November Race Report

Towards the end of October things really started to come together for my running and I have been able to carry it through in November. I am not sure what has led to this breakthrough because there are many candidates. I am at sea level, wearing lighter shoes, sans beer (not by choice, mind you) and using a standing desktop in the room. . . who knows.

Start of the Marine Corps Birthday 5k. Photo courtesy of MWR.

Sandwiching some distance between two 5k’s

The 5k races on my camp are at fairly random intervals depending on what events the Morale, Welfare and Recreation People decide to highlight. On the 7th of November we had the 3rd Army Birthday 5k and on the 10th I ran the Marine Corps Birthday 5k. A friend who was training up for a 24-hour race that we’re doing over New Year’s was doing a long run on evening of the 8th and I told him I would join him for support.

Start of the 3rd Army Birthday 5k. Photo courtesy of MWR.
The Army Birthday 5k went pretty well. The one other soldier who usually beats me without breaking a sweat was not there and, after a passing a few soldiers who went out too fast, I had the course to myself. My first and last kilometer splits were within five seconds of each other so I was happy with how the pacing went for this one.

Feeling good at the 1k. Photo courtesy of MWR.

Finishing the 3rd Army Birthday 5k. Photo courtesy of MWR.
As expected, my legs were a little tired for the Marine Corps Birthday 5k. My pace per mile suffered by about 13 seconds. Not all of this was due to fatigue though. This course was in a different part of the camp that featured all dirt roads. The elevation gain was about the same, but the inclines in this course are also closer to the end which, in my mind, makes it a bit harder.

Finishing the Marine Corps Birthday 5k. Photo courtesy of MWR.

America Recycles Day 5k


Start of the America Recycles 5k. Mr. Kibbet in the Nike shirt crushed us all. Photo courtesy of MWR.
Apparently there is an actual day for America recycling. The MWR here got into the spirit by giving out leftover shirts from previous races to finishers. Back on pavement and with a bit of time to recover I managed to just crack the 16:50 mark to set a deployment PR.


Run Q8: Heading to the Big City

Last month an email went out offering spots to a race in downtown Kuwait. I immediately walked over to our host nation office (which does these sorts of liaison events) and put down my 10 KD. When the big day finally arrived about 20 of us caravanned into downtown Kuwait. Since it was the weekend the driving felt less death defying than usual. There was the usual crowds of people miling about the start and group stretches. The crowd looked to be tilted slightly towards the expat community.

Area Support Group-Kuwait crew

The course started at the Marina Park and was a simple out-and-back along the gulf road. Unfortunately, the views of the gulf were generally blocked by buildings. But at least I figured it would be hard to get lost (a challenge I always accept).


The biggest difference I saw at the start was that in US races there is often a hesitation to crowd the start. In this race there was no such hesitation. I suspected from past year’s results that I would be in the top 10, but I could not squeeze my way to the front. Of course, as the Kuwaiti who finished behind me said, “you look a little big to be a fast runner”. True.

Start / Finish Area
The good news was that the field cleared out within the first 400 meters and I was soon in second. Mr. Kibbet, the speedy runner from our base who crushed the 10-mile last month, slowly disappeared from my view. The eventual second place runner passed me at about a kilometer and gradually pulled ahead by a few seconds per kilometer for the rest of the way.

The less good news was that there was a 12 mph headwind on the way out. There was some confusion on the turn-around with both 2nd place and myself running about an extra 100 meters, but no places were lost, so I did not think on it too much. Now the wind that had hounded us on the way out made for a nice negative split on the way home.

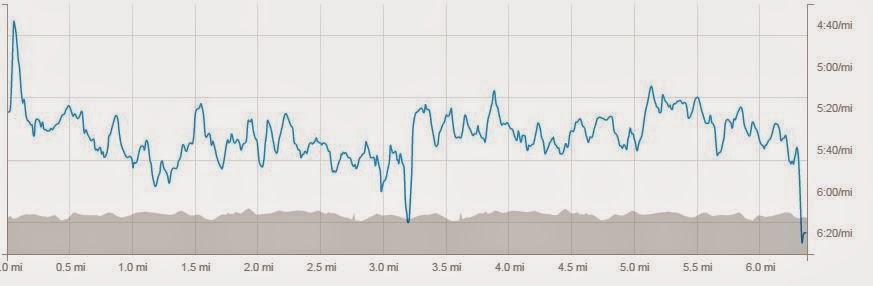
From the old pace chart you can see which half I had the wind to my back
I came in a solid 3rd in 35:26. While my GPS watch claimed I ran a PR pace, I think my personal rule will be to go with the official course time and try again another day.  There are many more races to come.


Monday, December 1, 2014

Running Regressions

Since I am no longer in the Excel dojo that I had in my civilian job, I needed some way to keep my skills sharp. So I decided to nerd out a little on my running log. In a previous post, I had noted the logarithmic relationship between distance and pace. While this was a pretty strong relationship I was curious about other factors. The effect of these factors though seemed harder to tease out of my data than the effects of pace versus distance, so I went full geek and did a multi-variable linear regression. Enjoy.

Deciding What to Test

After some thought and searching around the web, I settled on looking at the following factors:

·         Altitude
·         Temperature
·         Elevation gain

I chose these factors because they were easy to get for the races I have done this year. I have also done races over a wide variety of altitudes this year (Boulder, Ft. Bliss, Boise and Kuwait) so I have a lot more sample points than I usually have. I also had a decent spread of temperatures from 29 °F at the Frozen Foot 5k (February in Boulder) to an 86 °F run in Kuwait. I did not do any races with significant elevation gains this year (say over 300 ft per mile), but I started using Strava a lot more this year and it seems like a neat variable to test.

I did not look at other variables that like wind, elevation loss or technicality of terrain. Wind I did not choose to look at because most courses are loops and while you never get back from the wind what you give to it, I was not sure that I wanted to go back and figure out what percentage of each race was into the wind. Strava doesn’t give elevation loss and I did not feel like going through any more hassle to figure it out for point-to-point courses. Technicality of terrain I did not include because I was not sure how best to put a number to it. Perhaps next year when get back to doing tempo runs in the mountains I will revisit this one.

The dataset

While my racing for the first half of the year was light, during my deployment in Kuwait I am racing almost every week. Overall I had 13 races in my dataset. Not big enough to be truly statistically significant, but good enough for fun.


When I did a straight pace v. distance plot, the logarithmic relationship is still there, but it’s not as clean as it is with my PRs.

Pace versus Distance for my 2014 Races with a log curve fit
Pace versus distance for my personal records (with a log curve fit)

But I regress. . .

In a stats class offered through work I learned about the Linear Regression feature in Excel. The first step was to ensure that my variables had a linear relationship to pace (in other words, doubling the altitude doubles its effect on your pace). A little Googling found Run Works which takes formulas from Jack Daniels (no not that one) and other exercise physiology sources. This site allows you to put in a time and distance and then gives you estimated times for different altitudes, elevation gains, etc. It appeared that at least based on the formulas that other experts used, altitude, elevation gain and temperature had a reasonably linear relationship to pace.

Pace versus Altitude for a 16:49 5k at sea level (Source: Run Works / Jack Daniels' formulas)

Pace versus Altitude for a 16:49 5k with 40 ft of elevation gain (Source: Run Works / Jack Daniels' formulas)

Pace v. Temperature for a 16:49 5k at 50 F (Source: Run Works / Jack Daniels' formulas)
For altitude I used the average value for the race (rounded to about 100ft). I got my weather data from NOAA for each race. The elevation gain I got from Strava which I believe used the digital terrain mapping (DTM) data from Google Earth or Maps.

Results

Using a distance only gave me an R squared value of 0.79 (the closer to 1 the better the prediction). Throwing in altitude, elevation gain and temperature brought this up to 0.87. Not bad.


As one final experiment I also added a Boolean variable to account for if a race was proceeded by a major training event. For example, I ran the Bolder Boulder this year one week after a marathon. Another recent race in Kuwait was a 5k that I ran two days after an 18-mile long run and three days after another 5k. Incorporating this brought my R squared value up to 0.93. 

But there was one more bit of nerdiness to tease out. Among the results of Excel’s regression is the P-value. This stat gives you an indication of how important this variable is (or how likely the fluctuations in your dependent variable appear to be due to any particular variable). Basically, the lower the P-value the more important your variable is.

The variable, in order of predictive power on my pace were:

Distance
Altitude
Major Training Event
Temperature and Elevation gain (roughly tied)

So What

The other neat thing I can now do is plot the predicted pace again what I actually ran. If my pace is faster than the predicted value then that indicates that I had a good race and the result gives me some kind of indication of how good of a race I had (or vice versa). Additionally, if I found a random distance under some odd conditions (say a neat 18.5k race at 2000 ft in the crisp fall air), this formula could also give me an idea of how to pace myself.

Variation in my actual pace for the race versus the predicted pace
Above zero means that I ran a faster than predicted pace
It was a fun experiment on something I've been musing about for a while. It's not perfect and, in the academic sense, probably not statistically very meaningful. But I can live with that. The imperfections leave a bit of mystery and room for a bit of the passion involved in running.